Renesas e²studio
Jump to navigation
Jump to search
Creating a project from scratch
When creating a new project with e²Studio, you can set it up to work with J-Link as follows:
- Select New -> C/C++ Project from the File menu.
- Select the project template. Click Next.

- Fill in the project name (eg. 'Test'). Click Next.

- Select J-Link ARM as Debugger. Select your target device and the data endianess. Click Finish.
- In case only Next is available, click it until Finish is available. Then click Finish.

- For Renesas RX targets, select Segger JLink (RX) instead and check Create Hardware Debug Configuration.

- The wizard may ask you that this project is associated with C/C++ Perspective. Click Yes in this case.
Using an existing project with J-Link
If you already have an e²Studio project, you can change it to work with J-Link with following steps:
- Select Project -> Properties.
- Select Run/Debug Settings and the Launch configuration for your project (Normally the same name as your project). Click Edit.

- Tab Debugger: Select J-Link ARM as Debug Hardware and select your Target Device. For Renesas RX targets, select Segger J-Link (RX) instead.
- Tab GDB Settings: Check Autostart local GDB server.

Attach to a running target
- Tab Connection Settings: Set Hot Plug to Yes if the target is already running.
Note:
The "Terminate" option in e²studio leaves the target halted so trying to then hotplug could fail. Either reset the target first or else use the "Disconnect" option which should leave the MCU running.
The "Terminate" option in e²studio leaves the target halted so trying to then hotplug could fail. Either reset the target first or else use the "Disconnect" option which should leave the MCU running.

Enabling Trace
Trace Viewer
The trace viewer feature will use buffer tracing as the trace source.
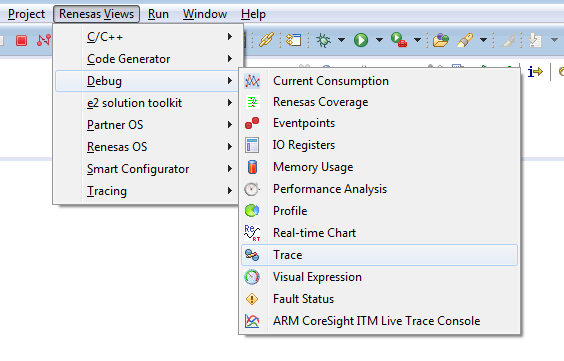
- The Trace view can be activated in the menu Renesas Views -> Debug -> Trace

- The Trace view will now be the active tab in the list of debug views.
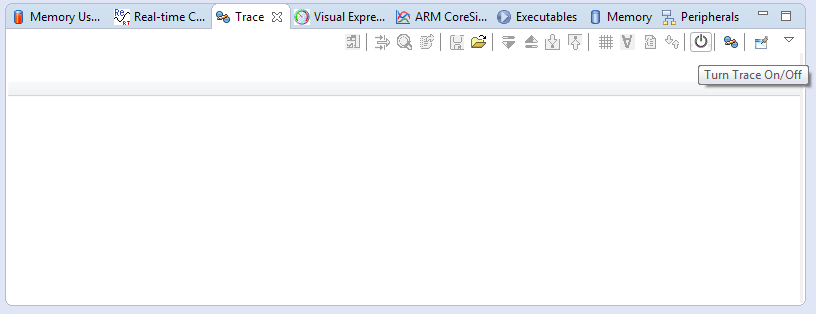
- Trace can be activated by clicking the On/Off button in the top right corner of the view

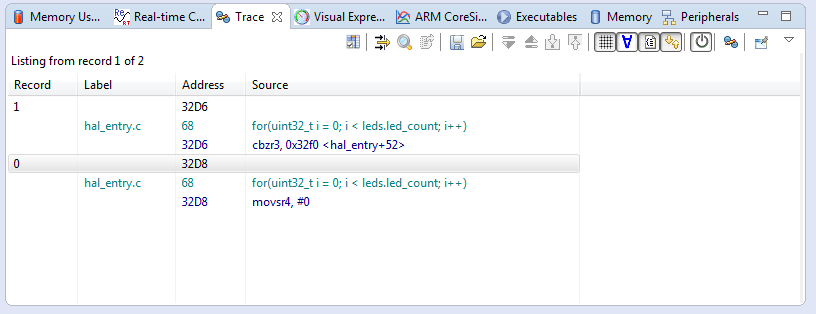
- Trace is now activated and will show trace data every time the device is halted

Live Trace Console
The Live Trace Console feature will use ITM data which will be send out via SWO. To set it up do as follows:
- Make sure that J-Link is selected as debug probe as described in the sections above.
- Open the Debug Configuration and go to Debugger->Debug Tool Settings->Operating Frequency [MHz]
- Here set the clock source speed for the SWO pin which is usually the CPU clock speed. For more information see the SWO article.

- Now open the .launch file in the project explorer
- Switch to the "Source" view of the file

- Look for variable jlink.connection.swv.coreClockSpeed
- Set that variable to the wanted final SWO clock speed between target device and J-Link. The value is in MHz.
- Save the changes
- Start the debug session
- Open Debug->Live Trace Console
- Enable Live Trace

- Open the settings panel of the Live Trace Console

- Enable features as needed e.g. as follows

- Continue debug session
If everything went correctly a file should pop up now showing the recorded trace data when halting.