J-Probe
Introduction
The following chapter introduces J-Probe, highlights some of its features and gives a beginners guide on how to use it.
What is J-Probe?
J-Probe is a software to analyze and visualize data as well as interacting with the target in real-time, while the target is running. J-Probe requires a J-Link / Flasher as an interface to the target hardware.
Technology used
Sampling is done using SEGGER High-Speed-Sampling (HSS) technology. This technology is available to all MCUs that provide background memory access. SEGGER HSS can be used without any further preparation.
Basic workings
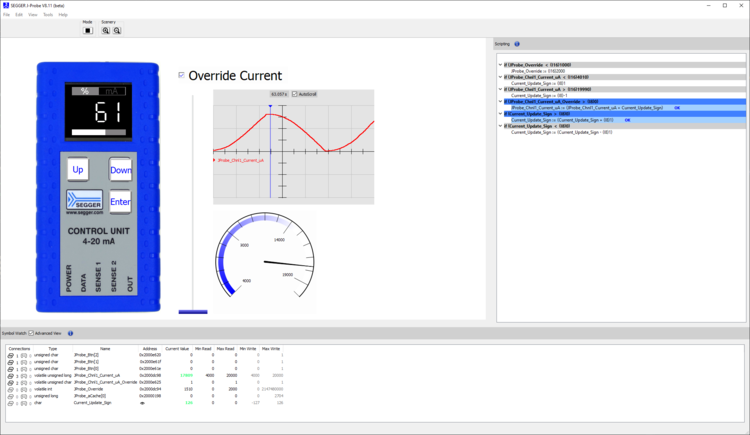
J-Probe has 3 modes the user can toggle between. The first one is Edit, in which the user can set up all the ways to interact with the target application that J-Probe provides. This includes static, passive and active modules, linking input devices (controller, steering wheel, etc.) and creating scripts. All modules can be freely arranged on the grid of the Module Board in terms of position and dimensions. Additionally, J-Probe provides multiple layers to put modules on, so that they are stacked in Run (lowest = background, highest = foreground). The second mode is Run, in which J-Probe connects to the target by attaching to a running application or downloading and restarting it. The modules and input devices are handled like setup in Edit and the scripts are actively evaluated. The UI changes such that the elements can be used instead of modified. At last, there is the Preview mode which displays everything like in Run but without connecting to the target.
UI Overview
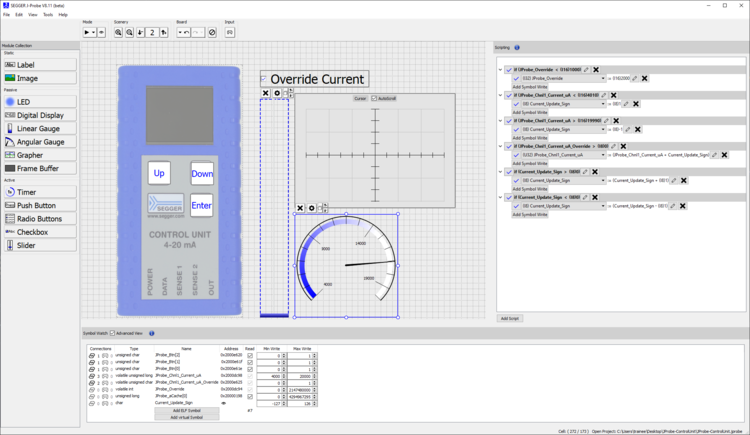
The entire J-Probe GUI consists of a menu bar, a tool bar, the Module Collection, the Module Board, the Symbol Watch Widget, the Scripting Widget and a status bar.
Menu Bar
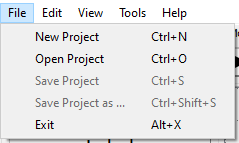
- File
- New Project: Create a new J-Probe project
- Open Project: Open existing J-Probe project
- Save Project: Save current project state by overwriting existing saved state
- Save Project as...: Save current project state as new project
- Exit: Close J-Probe
- Edit
- Copy Module: Copy currently selected module
- Paste Module: Paste currently selected module (at top left corner if no cell is marked)
- Undo: Undo last action in timeline
- Redo: Redo last undone action in timeline
- View
- Symbol Watch Table: Toggle visibility of symbol watch table
- Scripting Widget: Toggle visibility of scripting widget
- Set wallpaper: Select a wallpaper for the project
- Scale wallpaper to visible area only / entire board: Switch between setting for scaling the wallpaper when zooming in and out
- Tools
- Project Settings: Project specific settings (e.g. target device or ELF file)
- App Settings: Global J-Probe settings (e.g. how to startup)
- Help
- CheatSheet: Open dialog to show all shortcuts
- J-Probe User Guide: Open this website in the browser
- About J-Probe: License information
Tool Bar
The tool bar contains the following controls (left to right):
- Mode Switch
- Entering Run: Choice between attaching to running program or downloading and resetting program
- Enter Preview: Show how everything would look in Run but without establishing the J-Link connection
- Scenery
- Zoom in
- Zoom out
- Switch to lower layer
- Switch to higher layer
- Board
- Undo (single via arrow button or multiple via drop down menu)
- Redo (single via arrow button or multiple via drop down menu)
- Clear: Resetting everything except the project settings (modules, scripts, symbols, timeline and input devices)
- Input
- Open dialog to configure input devices like a controller, steering wheel or joystick
Status Bar
The status bar shows the currently opened project as well as the currently hovered cell, the marked cell and the currently copied module.
Symbol Watch Widget
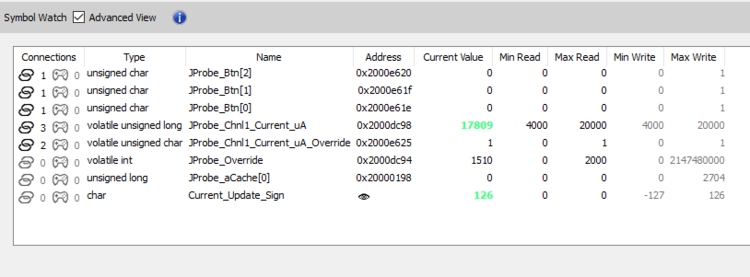
The symbol table displays all the important information for managing the read and write links between J-Probe and the symbols on the target.
In Edit:
- Connections: Indicator for how many modules and input devices are linked with this symbol
- Right click a symbol to unlink it from all connected modules and input devices or remove it from the table completely
- Type: Symbol data type (e.g. volatile float, int, etc.) - only visible in advanced view
- Name: Symbol name as declared in the source code
- Address: Memory address of the symbol on the target in hexadecimal or an eye icon if it is a virtual symbol - only visible in advanced view
- Read: Checkbox to select if the symbol should be read if optional (e.g. a pushbutton performing x = x+1)
- Min Write: Set minimum value that J-Probe is allowed to write into this symbol (e.g. percentage of something should always be >= 0) - only visible in advanced mode
- By default this value is the minimum number the datatype of the symbol can hold
- Max Write: Set maximum value that J-Probe is allowed to write into this symbol (e.g. percentage of something should always be <= 100) - only visible in advanced mode
- By default this value is the minimum number the datatype of the symbol can hold
- Catch Overflow: Select if J-Probe should prevent overflows when changing the symbols value (e.g. adding 1).
- By default overflows are caught
- QFormat: Select if J-Probe should treat a target integer symbol as fixed-point decimal.
- J-Probe will treat it as float in the UI while converting to and from the set QFormat right after reading from or just before writing to the symbol.
- Add ELF Symbol: Button to open dialog to select which of the target symbols should be available inside the J-Probe project
- Add virtual Symbol: Button to open dialog to create a new virtual symbol, virtual symbols can be used inside the J-Probe project but are unknown to the target
- Right click a symbol to unlink it from all connected modules and input devices or remove it from the table completely
In Run / Preview:
- Connections: Indicator for how many modules and input devices are linked with this symbol
- Type: Symbol data type (e.g. volatile float, int, etc.) - only visible in advanced view
- Name: Symbol name as declared in the source code
- Address: Memory address of the symbol on the target in hexadecimal - only visible in advanced view
- Current Value: Current value of the symbol on the target
- If J-Probe wrote to the symbol it assumes the value to be the written value until it gets read back, in this case the displayed value is prefixed with ' * '
- If the symbol is an integer, right-click the value to switch between decimal and hexadecimal view
- Min Read: Lowest read value of this symbol in this session - only visible in advanced mode
- By default this value is the minimum number the datatype of the symbol can hold
- If the symbol is an integer, right-click the value to switch between decimal and hexadecimal view
- Max Read: Greatest read value of this symbol in this session - only visible in advanced mode
- By default this value is the minimum number the datatype of the symbol can hold
- If the symbol is an integer, right-click the value to switch between decimal and hexadecimal view
- Min Write: Minimum value that J-Probe is allowed to write into this symbol - only visible in advanced mode
- Can be changed in Edit mode
- By default this value is the minimum number the datatype of the symbol can hold
- If the symbol is an integer, right-click the value to switch between decimal and hexadecimal view
- Max Write: Maximum value that J-Probe is allowed to write into this symbol - only visible in advanced mode
- Can be changed in Edit mode
- By default this value is the minimum number the datatype of the symbol can hold
- If the symbol is an integer, right-click the value to switch between decimal and hexadecimal view
Scripting Widget
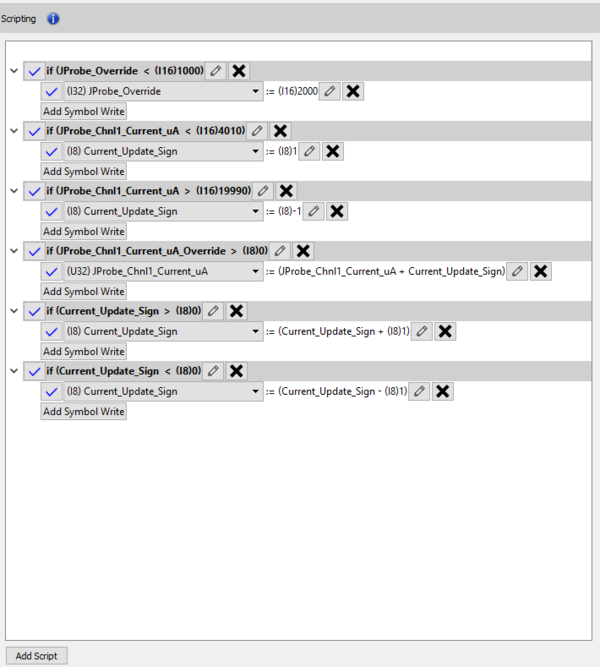
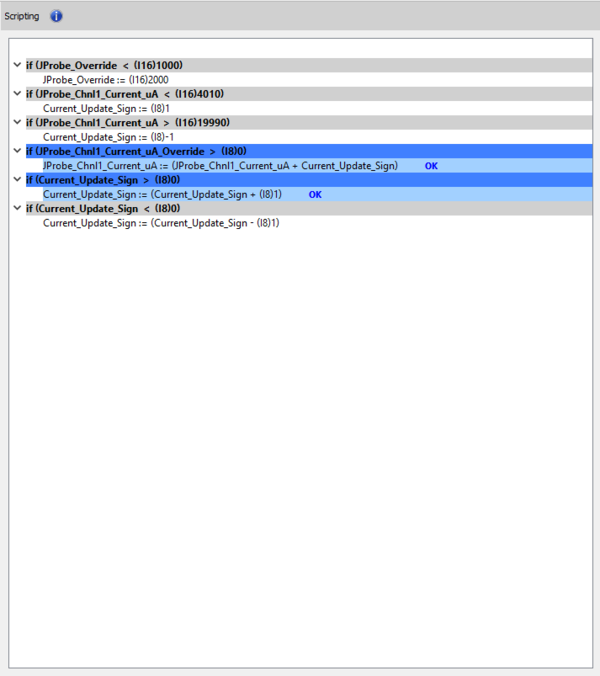
The scripting widget provides a way to configure conditioned autonomous writes to the target.
There is no limit for the number of scripts. Each script consists of 1 logical formula and up to 16 symbol writes. Each symbol write is based on a freely configurable calculation containing symbols and constants.
During Run mode the scripts are evaluated top to bottom. If a script's logical formula evaluates to true the symbol writes associated with it get executed top to bottom.
Module Collection
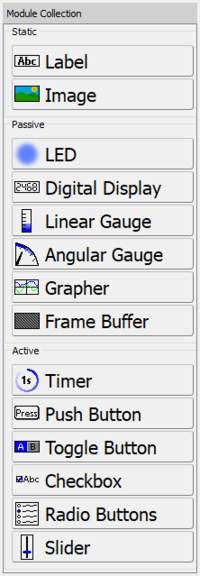
The module collection provides an overview over all the modules the user can choose from to visualize, analyze and interact with the data on the target. By clicking on one of the modules in the collection a dialog for setting up the new module will appear. Alternatively the user can also just drag one of the modules onto the Module Board to quickly add it to the project.
Static Modules
Static modules are modules with no access to data on the target.
| Module | Discription |
|---|---|
| Label | Field for plain text |
| Image | Static image frame |
Passive Modules
Passive modules are modules with a read only access to data on the target.
| Module | Discription |
|---|---|
| LED | A round fading display to show a color or blink with a color if value of connected symbol is ==, <, <=, > or >= reference or value is rising or falling |
| Digital Display | 8-bit display for numbers in binary, octal, decimal or hexadecimal number system |
| Linear Gauge | Linear progress bar with a customizable minimum and maximum value, can be used in horizontal or vertical orientation |
| Angular Gauge | Speedometer like linear scaled gauge with customizable minimum and maximum value, can be used in 90°, 180° and 270° mode |
| Grapher | Oscilloscope like display to visualize data, inspired by SEGGER J-Scope |
| Framebuffer | Image constructed by interpreting a block of memory as color encoding |
Active Modules
Active modules are modules with a read and write access to data on the target.
| Module | Discription |
|---|---|
| Timer | Animated timer to schedule a periodic write operation |
| Push Button | Button to perform a write operation on push, hold and release |
| Toggle Button | Button that can be toggled between two customizable states and can perform a write operation if toggled |
| Checkbox | Button with a label that holds its state and can perform a write operation when getting checked or unchecked |
| Radio Button | Exclusive group of buttons where each one can perform a write operation when getting selected or unselected |
| Slider | Draggable handle with custom minimum and maximum value that performs a write operation every time the handle is dragged by the user, can be used in horizontal or vertical orientation |
Available write operations by symbol type
| Type | Set to constant | Add constant | Subtract constant | Multiply by constant | Divide by constant | Invert | AND | OR | XOR | Bitshift Left | Bitshift Right |
|---|---|---|---|---|---|---|---|---|---|---|---|
| float | |||||||||||
| double | |||||||||||
| bool | |||||||||||
| unsigned 8-bit integer | |||||||||||
| unsigned 16-bit integer | |||||||||||
| unsigned 32-bit integer | |||||||||||
| signed 8-bit integer | |||||||||||
| signed 16-bit integer | |||||||||||
| signed 32-bit integer |
Module Board
The module board is the main widget of J-Probe in which the selected modules can be arranged, scaled, set up and layered.
Mouse Workflow
Module Creation
Generally, modules can be created via the Module Collection, pasting a previously copied module or left-clicking the marked cell again. When clicking a button in the Module Collection the Settings dialog for the new module will be opened and the module than created at the top left corner of the Module Board. The alternative way is to drag from a button from the Module Collection on to the Module Board freely where it is created with the default settings. A module can be copied via right-click -> "Copy" and pasted by right-click -> "Paste" on an unoccupied cell. A cell becomes the marked cell by simply clicking an empty cell. New modules are always added at the currently selected layer.
Module Modification and Arrangement
Changing module settings can be done by right-click -> "Settings" or by clicking the gear button at the top-left of a selected module. A module becomes the selected one by getting clicked. By dragging at its bottom right-corner a module can be resized in width and height. If a module is selected its size can also be modified by holding Ctrl while scrolling the mouse wheel. By dragging at its right border a module can be resized in width. By dragging at its bottom border a module can be resized in height. By dragging at anywhere else in a module it can be moved without being resized. If a rectangle gets dragged by starting at an empty cell a group selection can be created. The selected modules can be moved as one (keeping their relative positions) by dragging at any one of it. Right-click -> "Change Layer" allows to move a single module or an entire group of modules to another layer. If a module is selected its layer can be changed via the three buttons at the top left of it.
Module Deletion
A module can either be removed by right-click -> "Remove" or by clicking the X-button at the top left of the selected module.
Board View
Using mouse scroll wheel(s) or the scrollbars around the Module Board the entire grid gets moved around. The view can be zoomed in or out by using the buttons in the tool bar or by scrolling while holding Ctrl and having no module selected. Right-clicking on an empty cells allows to set up the wallpaper.
Keyboard Shortcuts
| Shortcut | Action |
|---|---|
| Ctrl+N | Create new project |
| Ctrl+O | Open existing project |
| Ctrl+S | Save project |
| Ctrl+Shift+S | Save project as... |
| Ctrl+C | Copy state of currently selected module |
| Ctrl+V | Paste a copy of last copied state |
| Ctrl+Z | Undo last timeline event |
| Ctrl+Shift+Z | Redo last undone timeline event |
| Ctrl+, | Open project settings |
| Ctrl+Shift+, | Open app settings |
| Alt+X | Exit J-Probe |
| F1 | Open cheat sheet |
| Ctrl+F1 | Open J-Probe user guide in browser |
| F12 | Open about dialog |
| F5 | Switch to Run / Edit |
| Ctrl+I | Open input device settings |
| Return/Enter | Open selected module settings |
| Up-Arrow | Move current module selection up |
| Down-Arrow | Move current module selection down |
| Left-Arrow | Move current module selection left |
| Right-Arrow | Move current module selection right |
| Ctrl+Up-Arrow | Move selected module's bottom edge up |
| Ctrl+Down-Arrow | Move selected module's bottom edge down |
| Ctrl+Left-Arrow | Move selected module's right edge left |
| Ctrl+Right-Arrow | Move selected module's right edge right |
| Del | Delete current module selection |
| Ctrl+A | Group select all modules on current layer |
| Tab | Jump current selection to next module on same layer |
| Shift+Tab | Jump current selection to previous module on same layer |
| Ctrl+L | Move current module selection to different layer |
| Page-Up | Move to higher layer |
| Page-Down | Move to lower layer |
| Ctrl while resizing a module | Keep aspect ratio |
| Shift while resizing or moving a module | Finer grid cells |
Starter Guide
Start J-Probe by double-clicking on the executable. The welcome dialog appears.
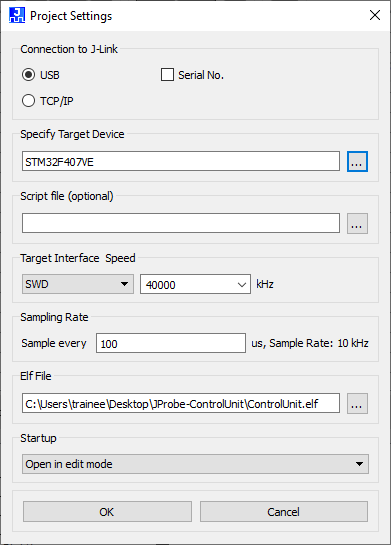
Select “New project” and press OK. J-Probe will open the Project Settings dialog.
Initialize Project
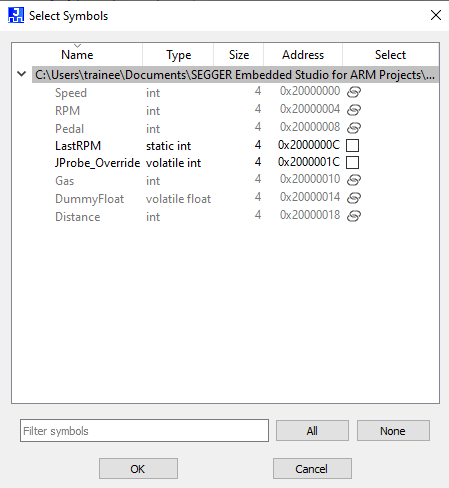
If J-Probe is used in standalone mode, using a dedicated connection to J-Link, choose “USB” or “TCP/IP” as connection type and optionally enter the serial number or the IP address of the J-Link to connect to a specific J-Link. HSS mode works by sampling memory locations in regular intervals. Therefore the sample rate and an ELF file are mandatory. The ELF file is used to determine the memory addresses of the sampled symbols. It is good practice to declare the symbols “volatile” in order to have them written to the memory as soon as possible. To use HSS, select your target device and ELF file and click OK. The Symbol Selection Dialog will open.
Selecting Symbols
Select the symbols of your application you want to watch and analyze. You can use the search input at the bottom to quickly search for a symbol name, type or address. To select array elements, enter the array index you want to see. For multidimensional arrays, seperate the dimension indices by dots, commas or spaces. Clicking "All" or "None" changes the selection status of all visible checkboxes. Click OK to finalize the setup. The Symbol Watch Widget now displays the selected symbols. Click the "+"-button underneath the last symbol to open the selection dialog again.
Create a Module
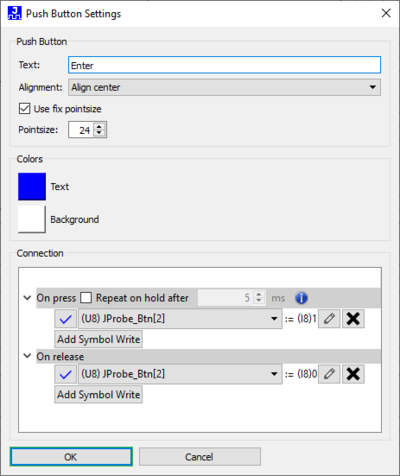
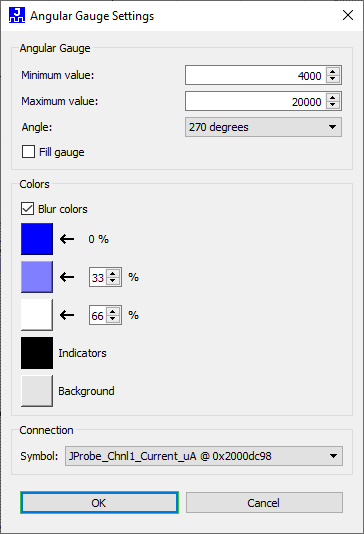
In the Module Collection drag a module onto the Module Board. Resize it to the desired dimensions by dragging at its edges. Click the settings gear button that appears at the modules top left to change its settings. A dialog like shown below will open. Configure the module as you like and click OK at the end. If the module should be moved to another layer, its settings must be changed or it should be deleted, use the buttons that pop up at its top-left corner.
Create a Script
In the Scripting Widget click on "Add Script" and a dialog for the script's formula will open. Create a valid formula and click OK at the end. Click "Add Symbol Write" once for each write you want to execute if the formula evaluates to true. For each write select the symbol to write to in the drop-down menu and setup the calculation to evaluate what to write to the symbol by clicking the button with the pen icon next to it.
Entering Run
After you have set up everything up like you want to, click the play-icon button in the tool bar or press F5 on your keyboard. If you switch to Run for the first time you will be asked if you want to download and restart the application. This option is always available via the drop-down menu in the Mode box in the tool bar in Edit. The UI will change, such that the Module Collection disappears as well as some controls in the toolbar and the grid lines. Also the Module Board will stack all modules according to their layers. To switch back to Edit, click the pause-icon button in the tool bar or press F5 on your keyboard.
Project Management
The project configuration, consisting of all the Modules with their preferences, the connected symbols, the ELF application file, the wallpaper, as well as the J-Link connection settings are saved in a J-Probe project file (.jprobe). The project file as well is saved in a project folder together with a copy of the used ELF file and the wallpaper. Everything needed for further work on the project is in one place to make sharing between users simple. To open a project file, the user can either select "Open Project" in the startup dialog or open a project file in J-Probe using "Open Project" within the “File” menu.
