RZ/G1
This page refers to the Reneas RZ/G1E (Cortex-A7 dual core) and RZ/G1M (Cortex-A15 dual core) processors. It provides examples to connect to the different cores as well as a J-Flash project + custom RAMCode, which allows to program any common SPI flash conntected to the (Q)SPI controller of the MCU.
RZ/G1 QSPI flash programming
The (Q)SPI memory controller of the RZ/G1 device family does *not* allow to read the content of the connected SPI flash, memory mapped. For this reason, direct flash programming (e.g. from within an IDE or J-Link Commander) is not possible. However, programming can be done using J-Flash as it allows to remap the content of the connected SPI flash to a virtual memory map. SEGGER has created an example J-Flash project (including a custom RAMCode) for the RZ/G1 which allows programming of any common SPI flash connected to the (Q)SPI flash controller of the MCU. No further special handling is required. A list of all supported SPI flashes can be found here: https://www.segger.com/jlink_supported_devices.html#SupportedSPIFlashes
J-Flash project
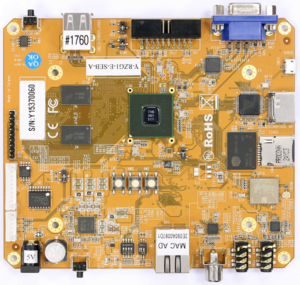
Below, the sample project including the custom RAMCode is available for download. It has been created and tested on the Y-RZG1-E-SEBA-A evaluation board. Following steps are required:
- Open project in J-Flash
- Open any data file to program in J-Flash
- Start programming using Auto (F7)
RZ/G1 Dual core debugging
The Renesas RZ/G1 is a dual core device. There are two variants of the RZ/G1:
- RZ/G1E dual core Cortex-A7
- RZ/G1M dual core Cortex-A15
By default, only one core (main core) is running which needs to release the second core from reset from within the application running on the main core.
Due to design limitations of the device, the second core cannot be easily enabled independently from the main core, via J-Link.
Dual core debugging on the RZ/G1
In order to debug both cores on the RZ/G1, the following needs to be done:
- Start a debug session for the main core, which uses the appropriate ConnectCore0 script
- Once the debug session has been started, it will have the second core enabled for debugging
- Start a debug session for the second core, which uses the appropriate ConnectCore1 script
- From now on, both cores can be debugged in parallel in both debugger instances
Script Files and sample projects
Below some sample script files for the dual core debugging as well as some sample projects for emIDE (V2.20 or later) and IAR EWARM (V7.40 or later) are available for download
- File:Renesas RZ G1E SampleProjects emIDE EWARM.zip
- File:Renesas RZ G1M SampleProjects emIDE EWARM.zip
- File:Renesas RZG1E ConnectCore0.JLinkScript
- File:Renesas RZG1E ConnectCore1.JLinkScript
- File:Renesas RZG1M ConnectCore0.JLinkScript
- File:Renesas RZG1M ConnectCore1.JLinkScript
Tracing on Renesas R8A77430 (RZ/G1M)
This section describes how to get started with trace on the Renesas R8A77430 (RZ/G1M) MCUs. This section assumes that there is already a basic knowledge about trace in general (what is trace, what different implementations of trace are there, etc.). If this is not the case, we recommend to read Trace chapter in the J-Link User Manual (UM08001).
Some of the examples are shipped with a compiled .JLinkScriptfile (extension .pex), should you need the original source, please get in touch with SEGGER directly via our support system: https://www.segger.com/ticket/.
To create your own .JLinkScriptfile you can use the following guide as reference: How_to_configure_JLinkScript_files_to_enable_tracingMinimum requirements
In order to use trace on the Renesas R8A77430 (RZ/G1M) MCU devices, the following minimum requirements have to be met:
- J-Link software version V7.98g or later
- Ozone V3.36 or later (if streaming trace and / or the sample project from below shall be used)
- J-Link Plus V12 or later for TMC/ETB trace
To rebuild the project our IDE Embedded Studio can be used. The recommended version to rebuild the projects is V8.16. But the examples are all prebuild and work out-of-the box with Ozone, so rebuilding is not necessary.
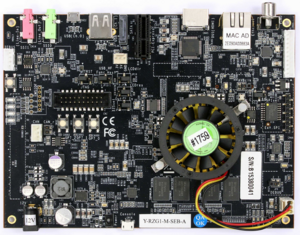
The project below has been tested with the minimum requirements mentioned above and a Y-RZG1-M-SEB-A.
- Example project: Renesas_RZ_G1M_TraceExample.zip
Trace buffer (TMC/ETB)
Open the *_TraceBuffer.jdebug project contained in the example project in Ozone.
Tested Hardware
Specifics/Limitations
The RZ/G1M series supports pin tracing by chip design. Since the evaluation board does not route these pins to a trace connector, we could not evaluate this and have thus not prepared an example. If you are interested in pin tracing this device, please refer our guide How_to_configure_JLinkScript_files_to_enable_tracing.
Tracing on Renesas R8A77450 (RZ/G1E)
This section describes how to get started with trace on the Renesas R8A77450 (RZ/G1E) MCUs. This section assumes that there is already a basic knowledge about trace in general (what is trace, what different implementations of trace are there, etc.). If this is not the case, we recommend to read Trace chapter in the J-Link User Manual (UM08001).
Some of the examples are shipped with a compiled .JLinkScriptfile (extension .pex), should you need the original source, please get in touch with SEGGER directly via our support system: https://www.segger.com/ticket/.
To create your own .JLinkScriptfile you can use the following guide as reference: How_to_configure_JLinkScript_files_to_enable_tracingMinimum requirements
In order to use trace on the Renesas R8A77450 (RZ/G1E) MCU devices, the following minimum requirements have to be met:
- J-Link software version V7.98g or later
- Ozone V3.36 or later (if streaming trace and / or the sample project from below shall be used)
- J-Link Plus V12 or later for TMC/ETB trace
To rebuild the project our IDE Embedded Studio can be used. The recommended version to rebuild the projects is V8.16. But the examples are all prebuild and work out-of-the box with Ozone, so rebuilding is not necessary.
The project below has been tested with the minimum requirements mentioned above and a Y-RZG1-E-SEB-A.
- Example project: Renesas_RZ_G1E_TraceExample.zip
Trace buffer (TMC/ETB)
Open the *_TraceBuffer.jdebug project contained in the example project in Ozone.
Tested Hardware
Specifics/Limitations
The RZ/G1E series supports pin tracing by chip design. Since the evaluation board does not route these pins to a trace connector, we could not evaluate this and have thus not prepared an example. If you are interested in pin tracing this device, please refer our guide How_to_configure_JLinkScript_files_to_enable_tracing.

